Mean, median, or mode? When to use each of them.
Pretend you wish to get an idea of the average value of your dataset. You’ve got a few choices available to you, of which the most common three are the mean, median and mode.
You might argue that the mode is a better choice than the median and the mean, mostly based on the below graphic.
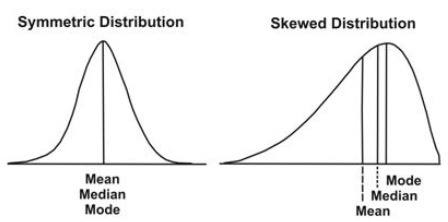
But the mode suffers from other problems. It will fail you on an exponential distribution, or on a log distribution. The mean and median will stand tall on the centrally-tended morally-high ground and you will rue your foolishness and cry to the heavens.
So should we use the median then? It’s well known that for a skewed dataset, the median is a much better choice than the mean - the picture above proves that point. Even for symmetric distributions, it’ll perform as well as the mean will. It seems like the best choice for every situation.
But - there’s this great quote:
"When a value is garbage for us, we call it an 'outlier' and we want to be robust against it - so we use the median. When the same value is attractive for us we call it "extreme' and we want to be sensitive to it - so we use the mean."
Maybe things are more complicated.
The strength of the mean is that it’s quick to calculate - all you have to do is sum up all observations, and divide by the total number of observations, and you’re done. In R:
calc_mean = function(vec) {
    return(sum(vec)/length(vec))
}
The median has to first order all the observations and then find the middle value. It’s a more complicated process:
calc_median = function(vec) {
    vec = sort(vec)
    if((length(vec) %% 2 == 0) ){
        return(vec[length/2] + vec[(length/2)-1])
    } else{
        return(vec(ceiling(length/2)))
    }
}
Finding the mean of a group of numbers is done in O(n) , whereas finding the median is an O(n log n)) operation.
This may not seem like a big difference, and isn’t for small datasets. But what happens if you have a lot of data?
Let’s run some quick simulations in R. We’ll calculate the time taken to find mean and median for a range of data sizes, going from 10,000,000 elements to 250,000,000 elements. We’ll do this 50 times and then plot the average calulation times on a graph.
Here’s the code for this:
trials = 50
vec_lengths = c(10000000,50000000,100000000,150000000,200000000,250000000)
mean_time = matrix(nrow = length(vec_lengths), ncol = trials)
median_time = matrix(nrow = length(vec_lengths), ncol = trials)
#generate vectors and runtimes for mean and median
for(j in 1:trials){
    set.seed(j)
    count = 1
    for(i in vec_lengths){
        x = rnorm(i)

        time_start = proc.time()
        mean(x)
        mean_time[count,j] = (proc.time() - time_start)[3]

        time_start = proc.time()
        median(x)
        median_time[count,j] = (proc.time() - time_start)[3]
        count = count + 1
    }
}

mean_time_rowmeans = rowMeans(mean_time)
median_time_rowmeans = rowMeans(median_time)

library(ggplot2)
ggplot(data = data.frame(mean_time = mean_time_rowmeans,
                         median_time = median_time_rowmeans,
                         size = vec_lengths),
       aes(x = vec_lengths)) +
    geom_point(aes(y = mean_time, colour = "mean")) +
    geom_point(aes(y = median_time, colour = "median")) +
    geom_line(aes(y = mean_time, colour = "mean")) +
    geom_line(aes(y = median_time, colour = "median")) +
    xlab("Number of Data Points") +
    ylab("Calculation Time (s)")
Here’s the results:
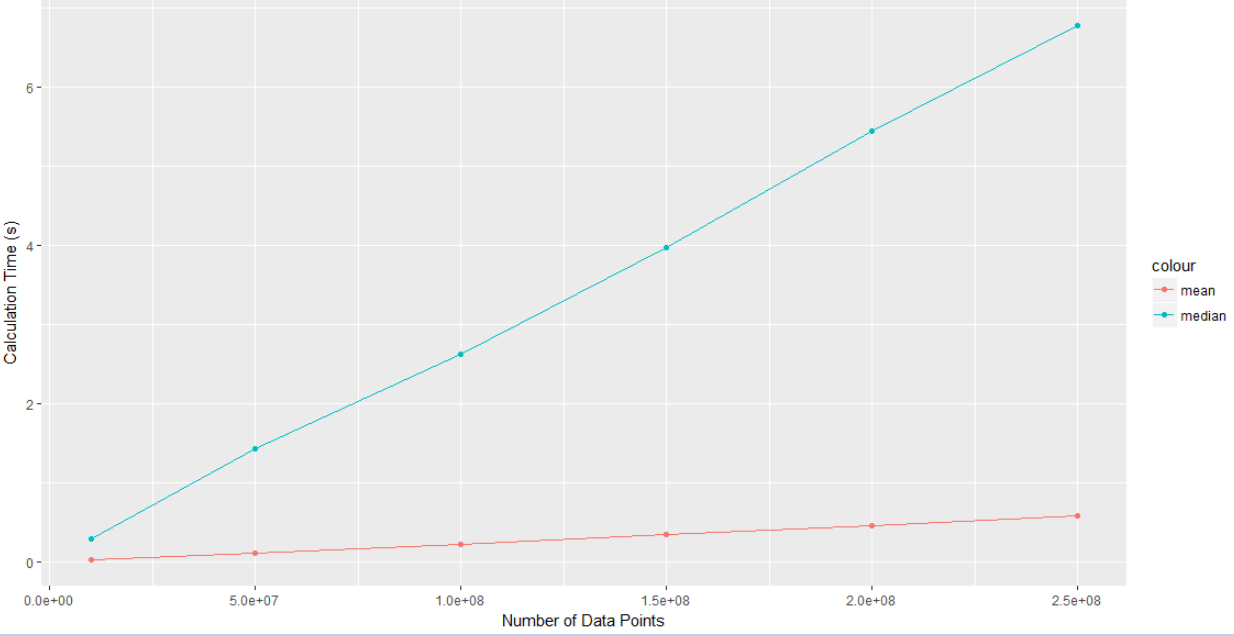
The median clearly scales worse than the mean does. Imagine you had a few billion data points, and you can start to see why these questions matter.
Conclusion Link to heading
The median and mean are fundamentally different concepts, and it can be oversimplifying to classify them as just different measures of the same thing. Sometimes they simply just answer different questions.
In broad terms, if you’ve got symmetric data and a lot of it, use the mean. If you’ve got skewed data and lots of it, you should use the median where possible, but you might have to use the mean if your data is too large. If you don’t have a lot of data, then just use the median for everything.
Tread carefully…and remember that the median isn’t always king.