Some things about map projections
The Earth is three dimensional, and maps are flat. How do you take a three dimensional Earth and put it on a flat surface? It’s difficult!
Ideally we wouldn’t have to use maps because we’d use globes for everything. But globes aren’t convenient. Flat maps can be viewed on computer screens, printed out, displayed on a wall, rolled up into a scroll, and are simply much more useful and convenient than globes are.
There’s another problem with globes in that they’re also only convenient to use at small scales. If you wanted to illustrate spatial data where you need suburb-level detail, you’d need a massive globe!
Two dimensional maps it is then. How do we make one? Through something called a projection.
Suppose you had a transparent globe with a light bulb in its centre, and you also had a big sheet of paper. What you could do is wrap the paper around the globe, so that the countries and features of the globe are be projected onto the paper. Then you could trace around the countries with a pencil to give yourself a two dimensional map of the world.
How you wrap the paper around the globe makes a big difference. There are three families of map projection: cylindrical, conical, and planar, and each refer to the way that you surround the globe with the paper:
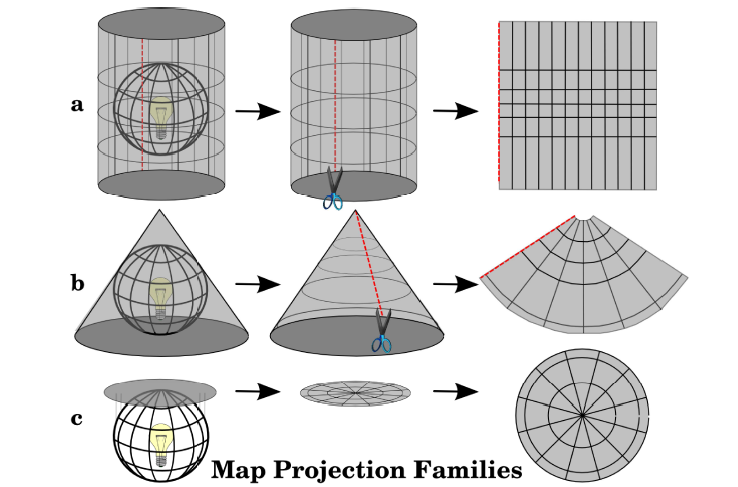
Diagram taken from “A Gentle Introduction to GIS” by Sutton, Dassau and Sutton
Unfortunately, every projection is distorted somehow - there’s no such thing as a perfect projection. Projections distort area, shape, distance or direction. You can have one accurate but then you must compromise on the others.
The common projections Link to heading
There exist many, many projections, of which a very few people have heard of most of them. This tool is an interesting way to explore some of these projections.
Here are some of the more common ones:
Mercator Projection Link to heading
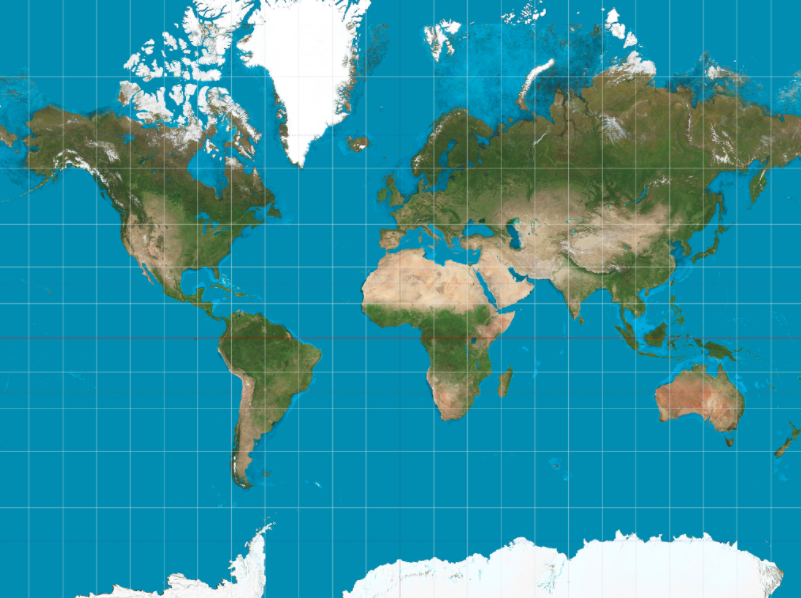
The Mercator projection is a cylindrical projection instantly recognisable as the “default” map projection, for better or for worse. While it is highly accurate at the equator, areas of countries towards the north and south poles are much larger than they should be.
A side effect of this projection being so prevalent is that people are often surprised when they see how big Africa really is. Being placed in the centre of the projection means that Africa is less affected by the significant vertical distortions affecting the likes of Russia and Greenland. Other projections represent Africa’s relative size a lot better than the Mercator projection does.
Many online maps use the Mercator projection, including those made by Google, Bing, OpenStreetMaps and Yahoo. Being more of a provider of local maps than global ones, it is unimportant to users that Greenland looks as big as Africa. Users are more interested in a conformal map: the scale is the same in all directions, angles are depicted correctly, and real life circles are depicted as circles on the map. In addition, the Mercator projection has a constant North direction wherever you are in the world.
Having said all this, the implementation by Google, Bing etc has some problems. This article explains these in some detail.
Robinson Projection Link to heading
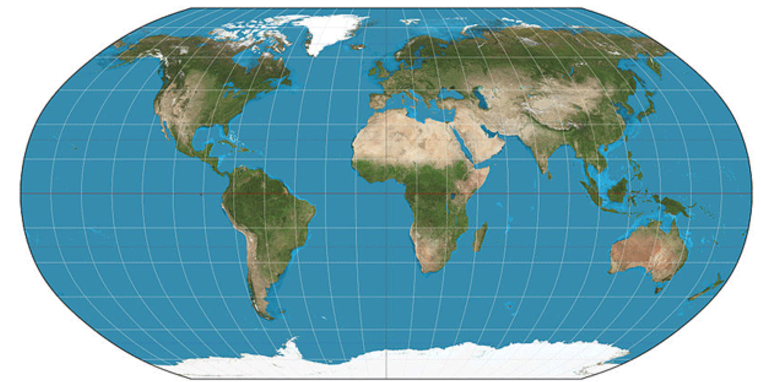
A compromise projection, the Robinson projection was created to “look right” rather than to measure distances exactly. It manages to fit the entire globe onto a flat surface where the distortion of areas is much better than that in the Mercator projection. The Robinson projection is another cylindrical projection.
The meridians on this projection curve gently towards the poles, which avoids an extreme distortion of shape. The flipside is that the poles become a line rather than a point - just look at Antartica dominating the southern hemisphere.
The Robinson projection has a unique history - unlike other projections, it wasn’t derived from a mathematical model. Rather it was constructed through computer simulations and a trial and error approach, and then a mathematical model devised to reproduce the end result.
Transverse Mercator Projection Link to heading
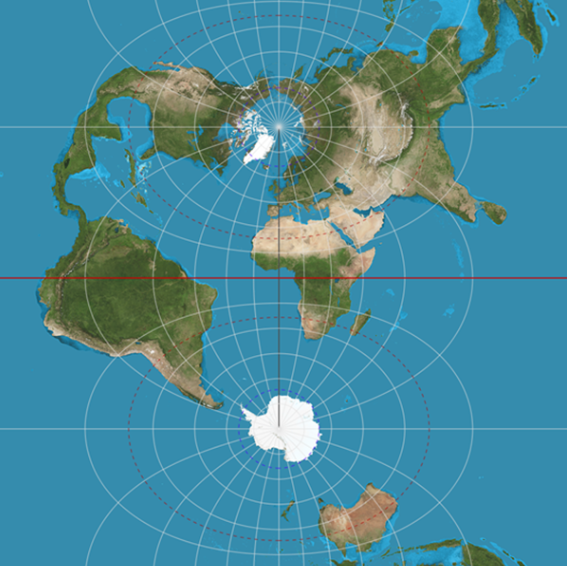
A variation of the Mercator projection, the transverse Mercator projection has a variable central meridian - you can place it along a number of meridians. Typically you’d place it at the location you’re interested in mapping, since this projection is highly accurate within about 5 degrees of its central meridian.
Both the Mercator projection and the transverse Mercator projection are very accurate in the middle of their mapping region. This makes them good choices for local mapping.
Like the regular Mercator projection, the transverse Mercator projection shouldn’t be used for showing the whole globe at once. The two have similar difficulties in mapping areas far away from the central meridian accurately. Using the transverse Mercator projection won’t fix the large distortion in areas at the boundaries of the map.
One difference between the two is where the distortion occurs. The regular Mercator projection has its area distortion on the extremes of the y-axis. The transverse Mercator projection, by contrast, is distorted heavily on the extremes of the x-axis.
The transverse Mercator projection is the basis for the Universal Transverse Mercator (UTM) mapping system. This system divides up the globe into many narrow longitude bands, and then applies the transverse Mercator projection with the central meridian located at the centre of each band. In this way the UTM mapping system isn’t a single map projection, but rather a number of them, and the location of features has to be specified relative to which longitude band it’s in.
One thing about the UTM system is that each longitude band uses a two-dimensional Cartesian coordinate system, rather than the more familiar degrees system. This can be confusing to newcomers.
Lambert Conformal Conic Link to heading
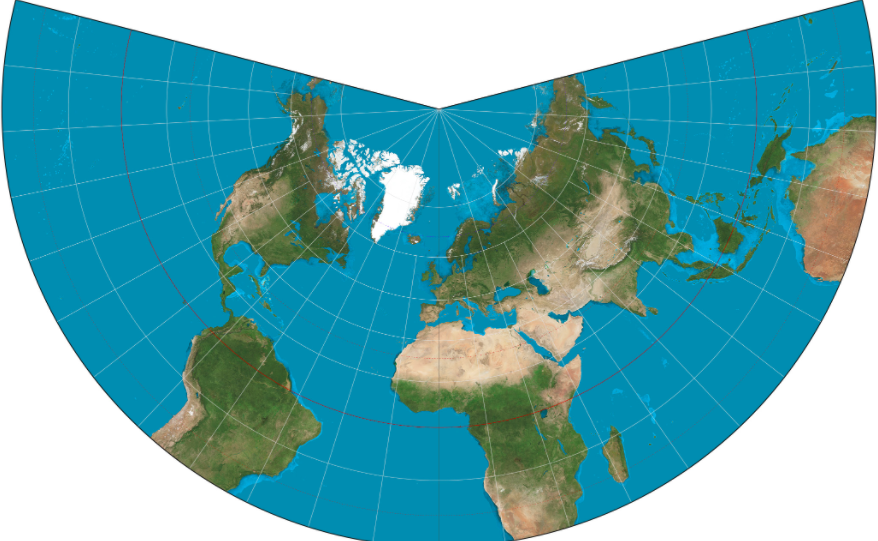
Place a cone over the Earth, and then project its surface onto the cone so that the angles of landmasses are preserved (also called a conformal projection). This is the basis of the Lambert Conformal Conic projection.
The circles of latitude (or parallels ) on the Earth that touch the cone are known as the standard parallels , and at these points the scale factor is 1. The Lambert Conformal Conic projection comes in either tangent or secant forms, which means that the cone will touch either one or two circles of latitude respectively.
The diagram below refers to the secant form of the projection.
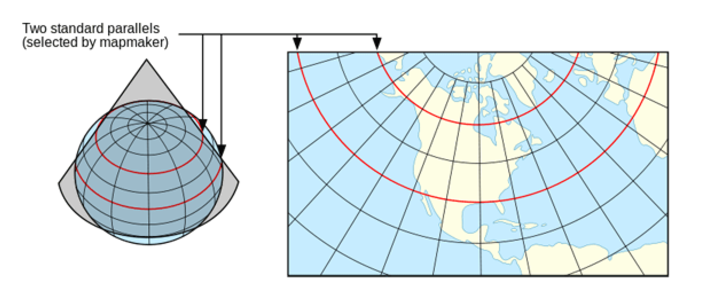
If the secant form is used, we have two standard parallels. Between the two parallels the scale factor decreases, and outside the two circles of latitude the scale factor increases.
The Lambert Conformal Conic is a conformal projection, meaning that the angles of countries are kept constant. The result of this is that area distortion is minimal near the two standard parallels, but increases as you move further away from them.
Primary uses of the Lambert Conformal Conic projection are by pilots and others who’d like maps accurate over large east-west distances. Its drawbacks means that it isn’t used for world maps, but rather for specific applications of mapping.