What is spatial data?
You probably hear a lot of talk about “spatial data”. Not as much as about BIG DATA or as about DEEP LEARNING, but enough so that if you clicked here, you’re just a little bit curious. So what is spatial data?
Spatial data is data that has a spatial component – the data took place somewhere , and that somewhere is important. The data is linked intricately to a place on Earth, and that place is relevant and important and you should care about its welfare.
Spatial data is called many different things. It can also be referred to as geospatial data, or as geographic information, or sometimes as spatial information.
What does spatial data look like? Link to heading
Spatial data usually comes in two formats: raster and vector.
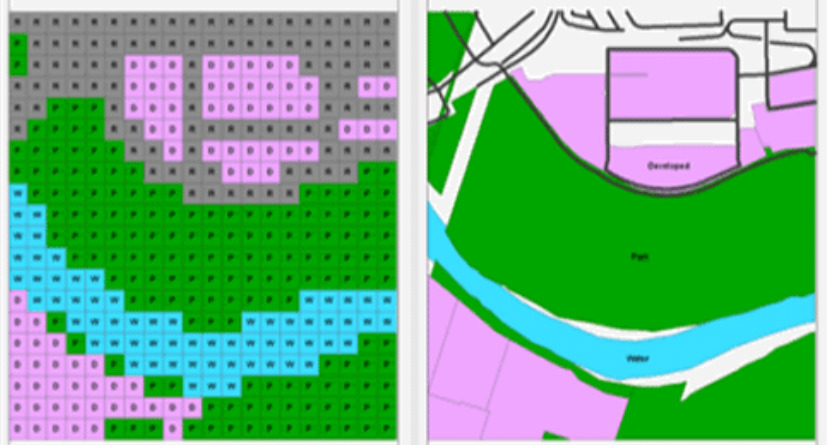
Raster on the left, vector on the right. Source.
Raster Link to heading
Raster stores data in a grid, consisting of rows and columns of cells. Think pixels on a computer screen, or art made out of Lego. That’s what raster data looks like.
Every grid has a value. There are no empty grids. Even if a grid has the value 0, it still has a value.
Many image formats can be used as Raster format data, like GIF, TIF and JPEG files. But to be useable, they’ve got to have reference information associated with the image to specify at what location the image is at. This process of taking an image and associating location information to it is called georeferencing.
Raster data is typically useful for things like weather cover, or of vegetation growth, or other things where satellite imagery comes in handy.
Vector Link to heading
Vector data is made of geometrical shapes. These shapes are also known as vector objects and are used to represent the location of features on the Earth.
Three common types of geometrical shapes are points, lines and polygons. Points are used for things like mountain peaks and wells – things that you can represent really well by just a dot on a map. Lines are used for things like rivers, roads, train tracks and property boundaries. Polygons are used for lakes, buildings, property areas, forests, and other things that you’d want to represent the area of.
You might also encounter polylines on your vectorial adventures. Polylines sound scary, but they’re just a collection of straight lines joined end to end. No more.
Attribute data can be associated with each geometrical shape. Cities could have as attributes their name, or their population, or the number of buildings that it contains. A lake could have as attributes water colour, depth and salinity.
Unlike raster data, empty spaces are allowed in vector data. The vectors show where features are present and the space around the features is empty.
Should I use vector or raster data? Link to heading
Vector and raster data are very different. But you knew that already.
One difference between the two is in speed. Raster data is quicker to process than vector data. But it’s likely that your computer is fast enough to work with either type quickly, so maybe you don’t care about this.
Vector data is more compact than raster data – the files will be smaller. Your hard drive is big enough that you probably don’t care about this either.
But then you find that your raster data resolution isn’t enough for what you want to do with it, so you go and double it. Then you notice that your data file has just quadrupled in size. Maybe you do care about file size after all.
Vector data is more intuitive than raster data, and it can support topological relationships between features. Because of this it’s probably a friendlier format for spatial analysis. As a bonus it’s easy to identify similar areas on your map, like areas with the same temperature or areas with the same elevation.
Ultimately often you just won’t get a choice. Data you want might only be available as one of the two formats, so it’s important to know how to work with each.